-
Services
-
Locations
- Philippines
- United States
- Colombia
- Eastern Europe
Locations -
Industries
-
Resources
- E-Books
- Blog
- Case Studies
Resources - About Us
- Careers
Our 2018 Client Survey: The Results!
Client First and Continuous Improvement have been two of our core values since Peak Support was founded in 2015. Driven by these values, we survey our clients every year to find out how we’re doing. The survey has grown as we’ve expanded from 3 clients in 2015 to 15 clients today, so for 2018 we surveyed a total of 25 people across all of our clients. We’ve always shared the data internally, but this year, for the first time, we wanted to share the results publicly as well.
Why share our client survey results?
I can’t overstate how valuable this client survey has been. In addition to the quantitative survey questions, we ask clients to share specific feedback, either positive comments or suggestions on how to improve. We’re not sharing those here, because they are client-specific, but we read them closely and often we’re able to take immediate action as a result.
Why are we making this public? Well, the numbers look good. But it also helps hold us accountable. If we commit to publishing this next year, and the year after, we’ll only put pressure on ourselves to continue to improve (#ContinuousImprovement).
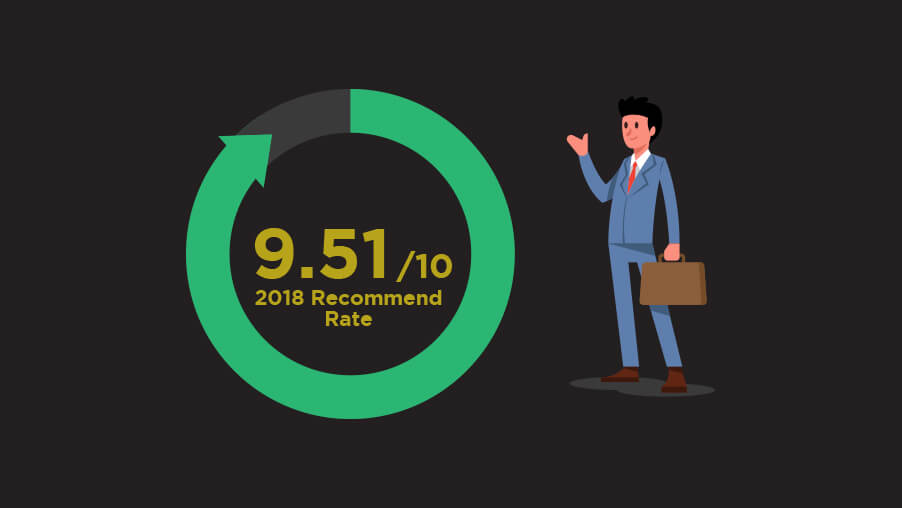
1. How do our clients assess our overall performance?
The most important question we ask our clients is whether they would recommend us, on a scale of 1 to 10. The average recommend rate is 9.51/10. We then use this data to calculate our Net Promoter Score (NPS).
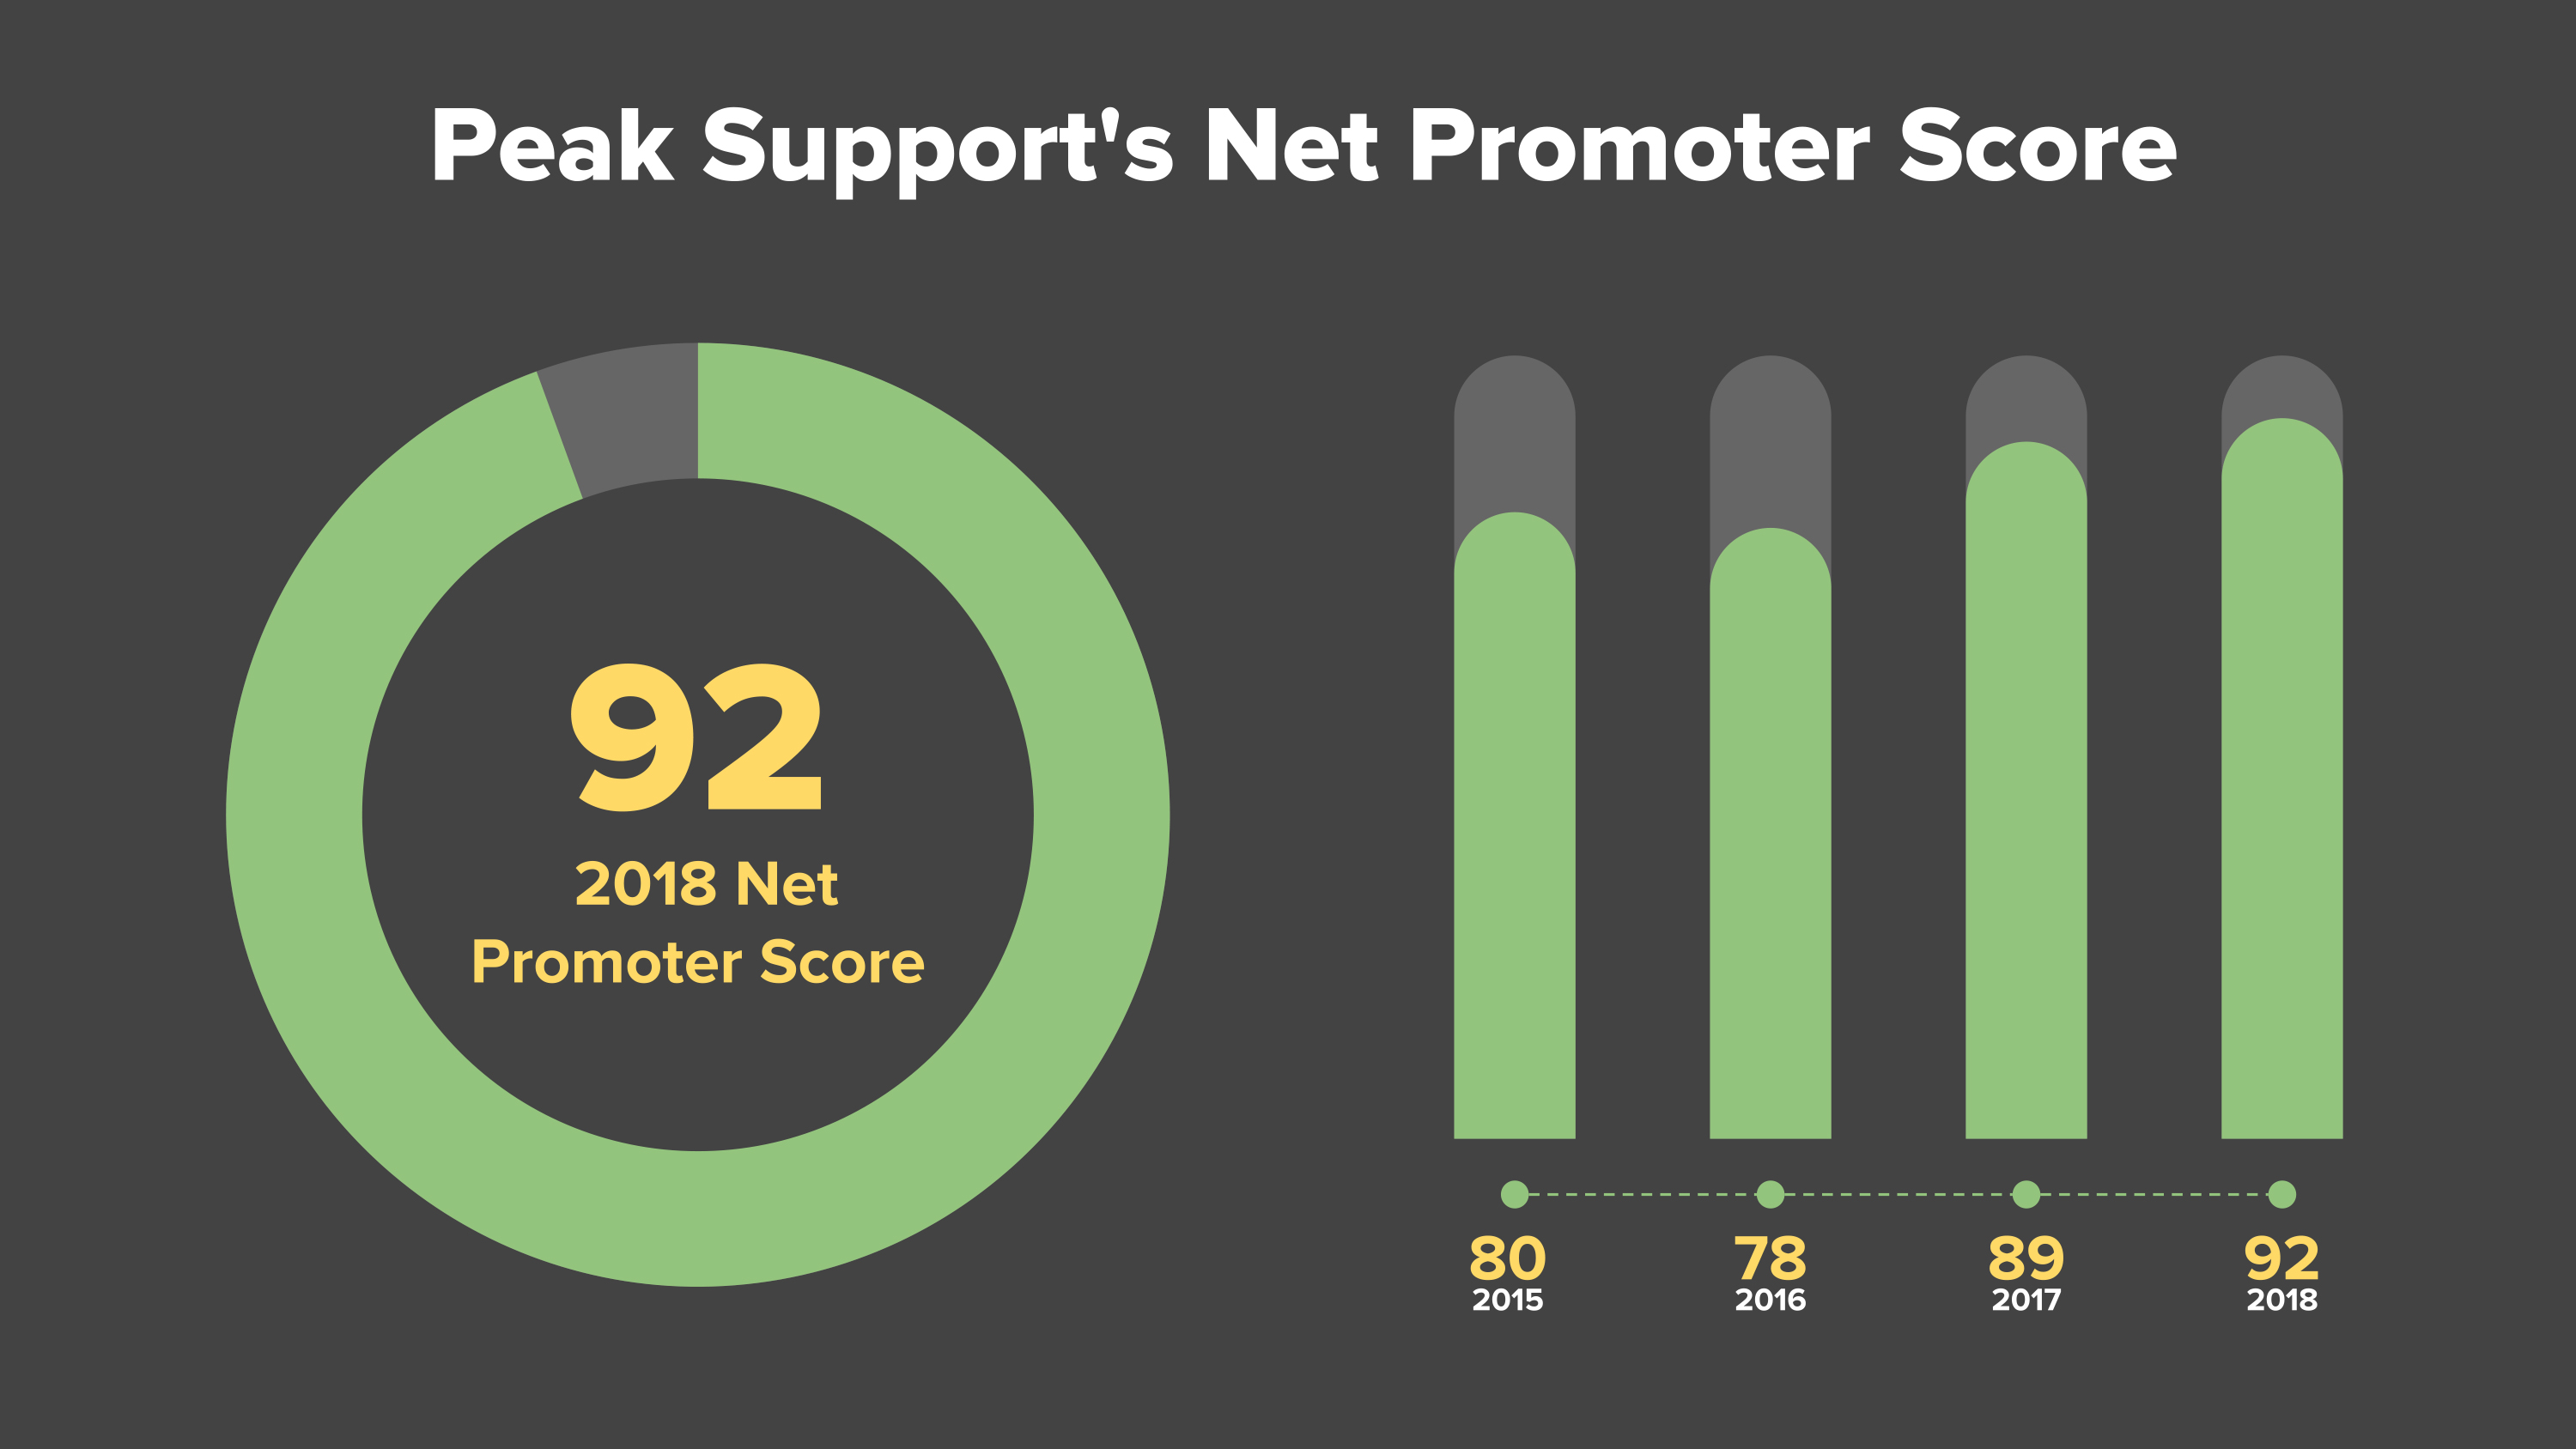
NPS is a commonly-used tool for measuring how likely your customers are to recommend your brand. Anyone who gives you a 9 or 10 is a considered a “promoter,” 7s and 8s are considered “passive,” and anyone who gives a rating below 7 is considered a “detractor.”
To calculate your Net Promoter Score, you subtract the percentage of detractors from the percentage of promoters. We had 92% promoters, and no detractors, giving us an NPS of 92 – a score that is considered “world class.”
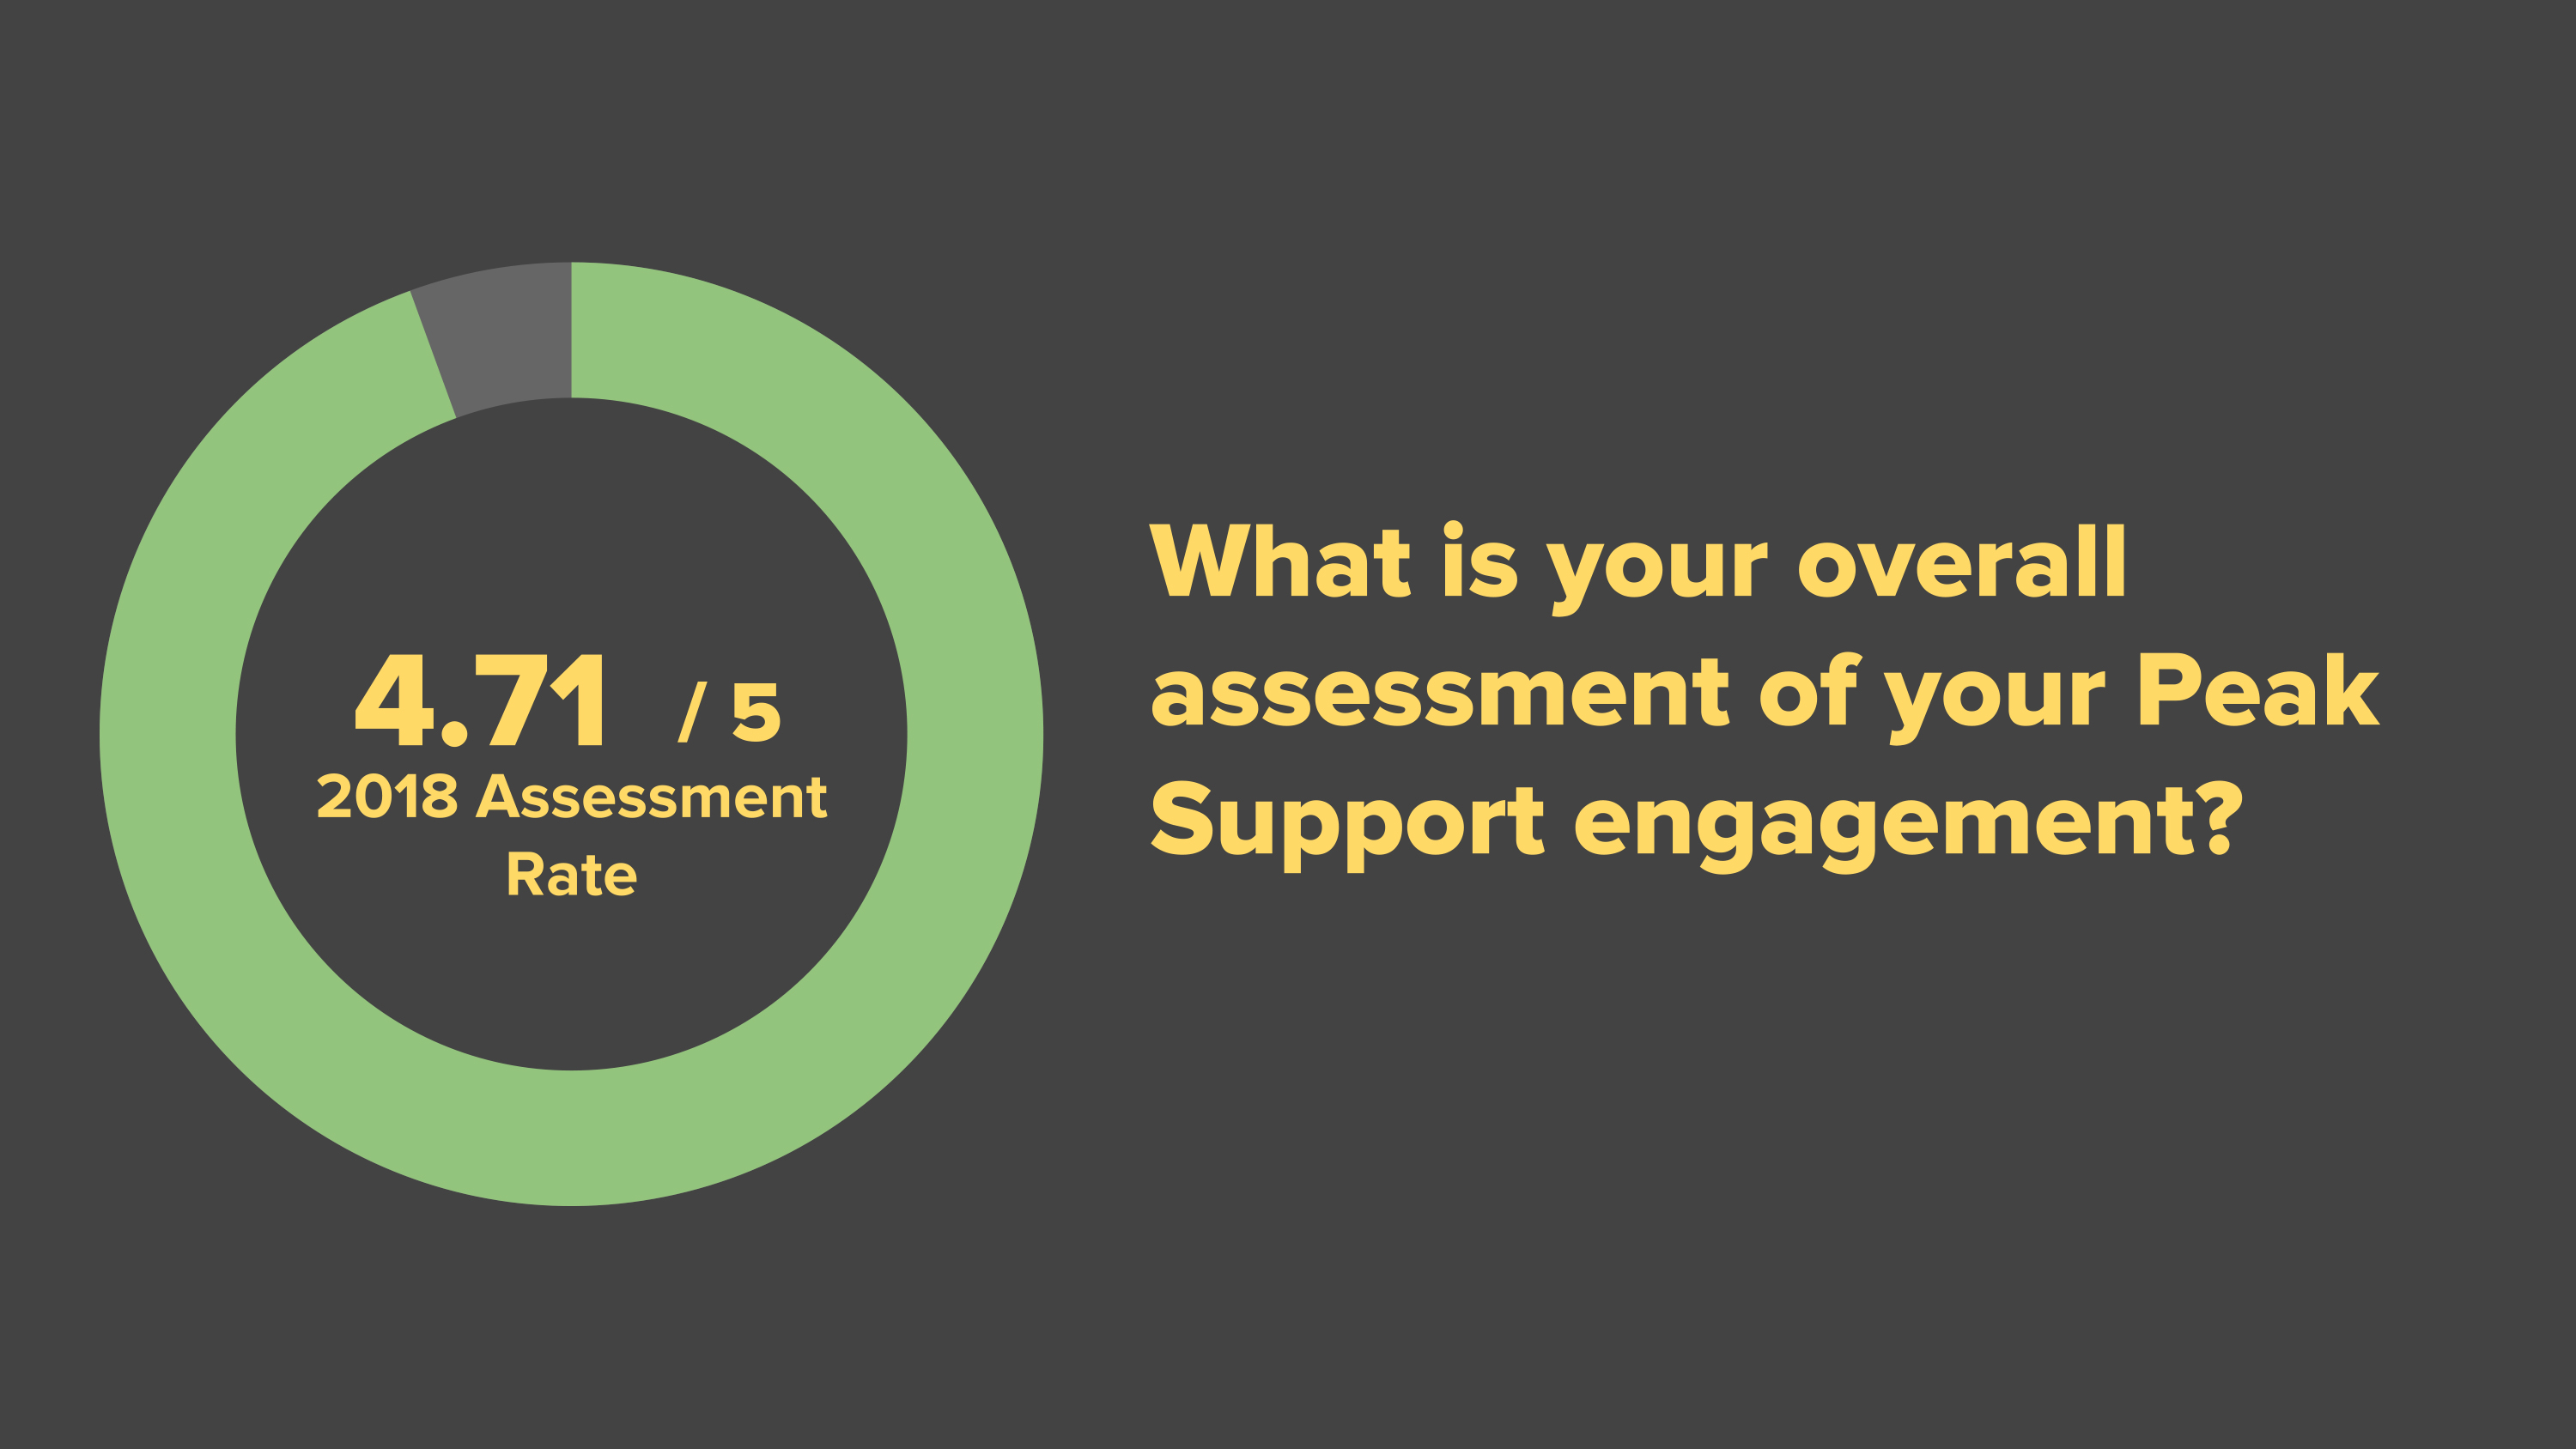
We also ask for an overall assessment of how well we’re doing on a scale of 1 to 5. We were pleased with this year’s number of 4.71, which roughly matched last year’s record.
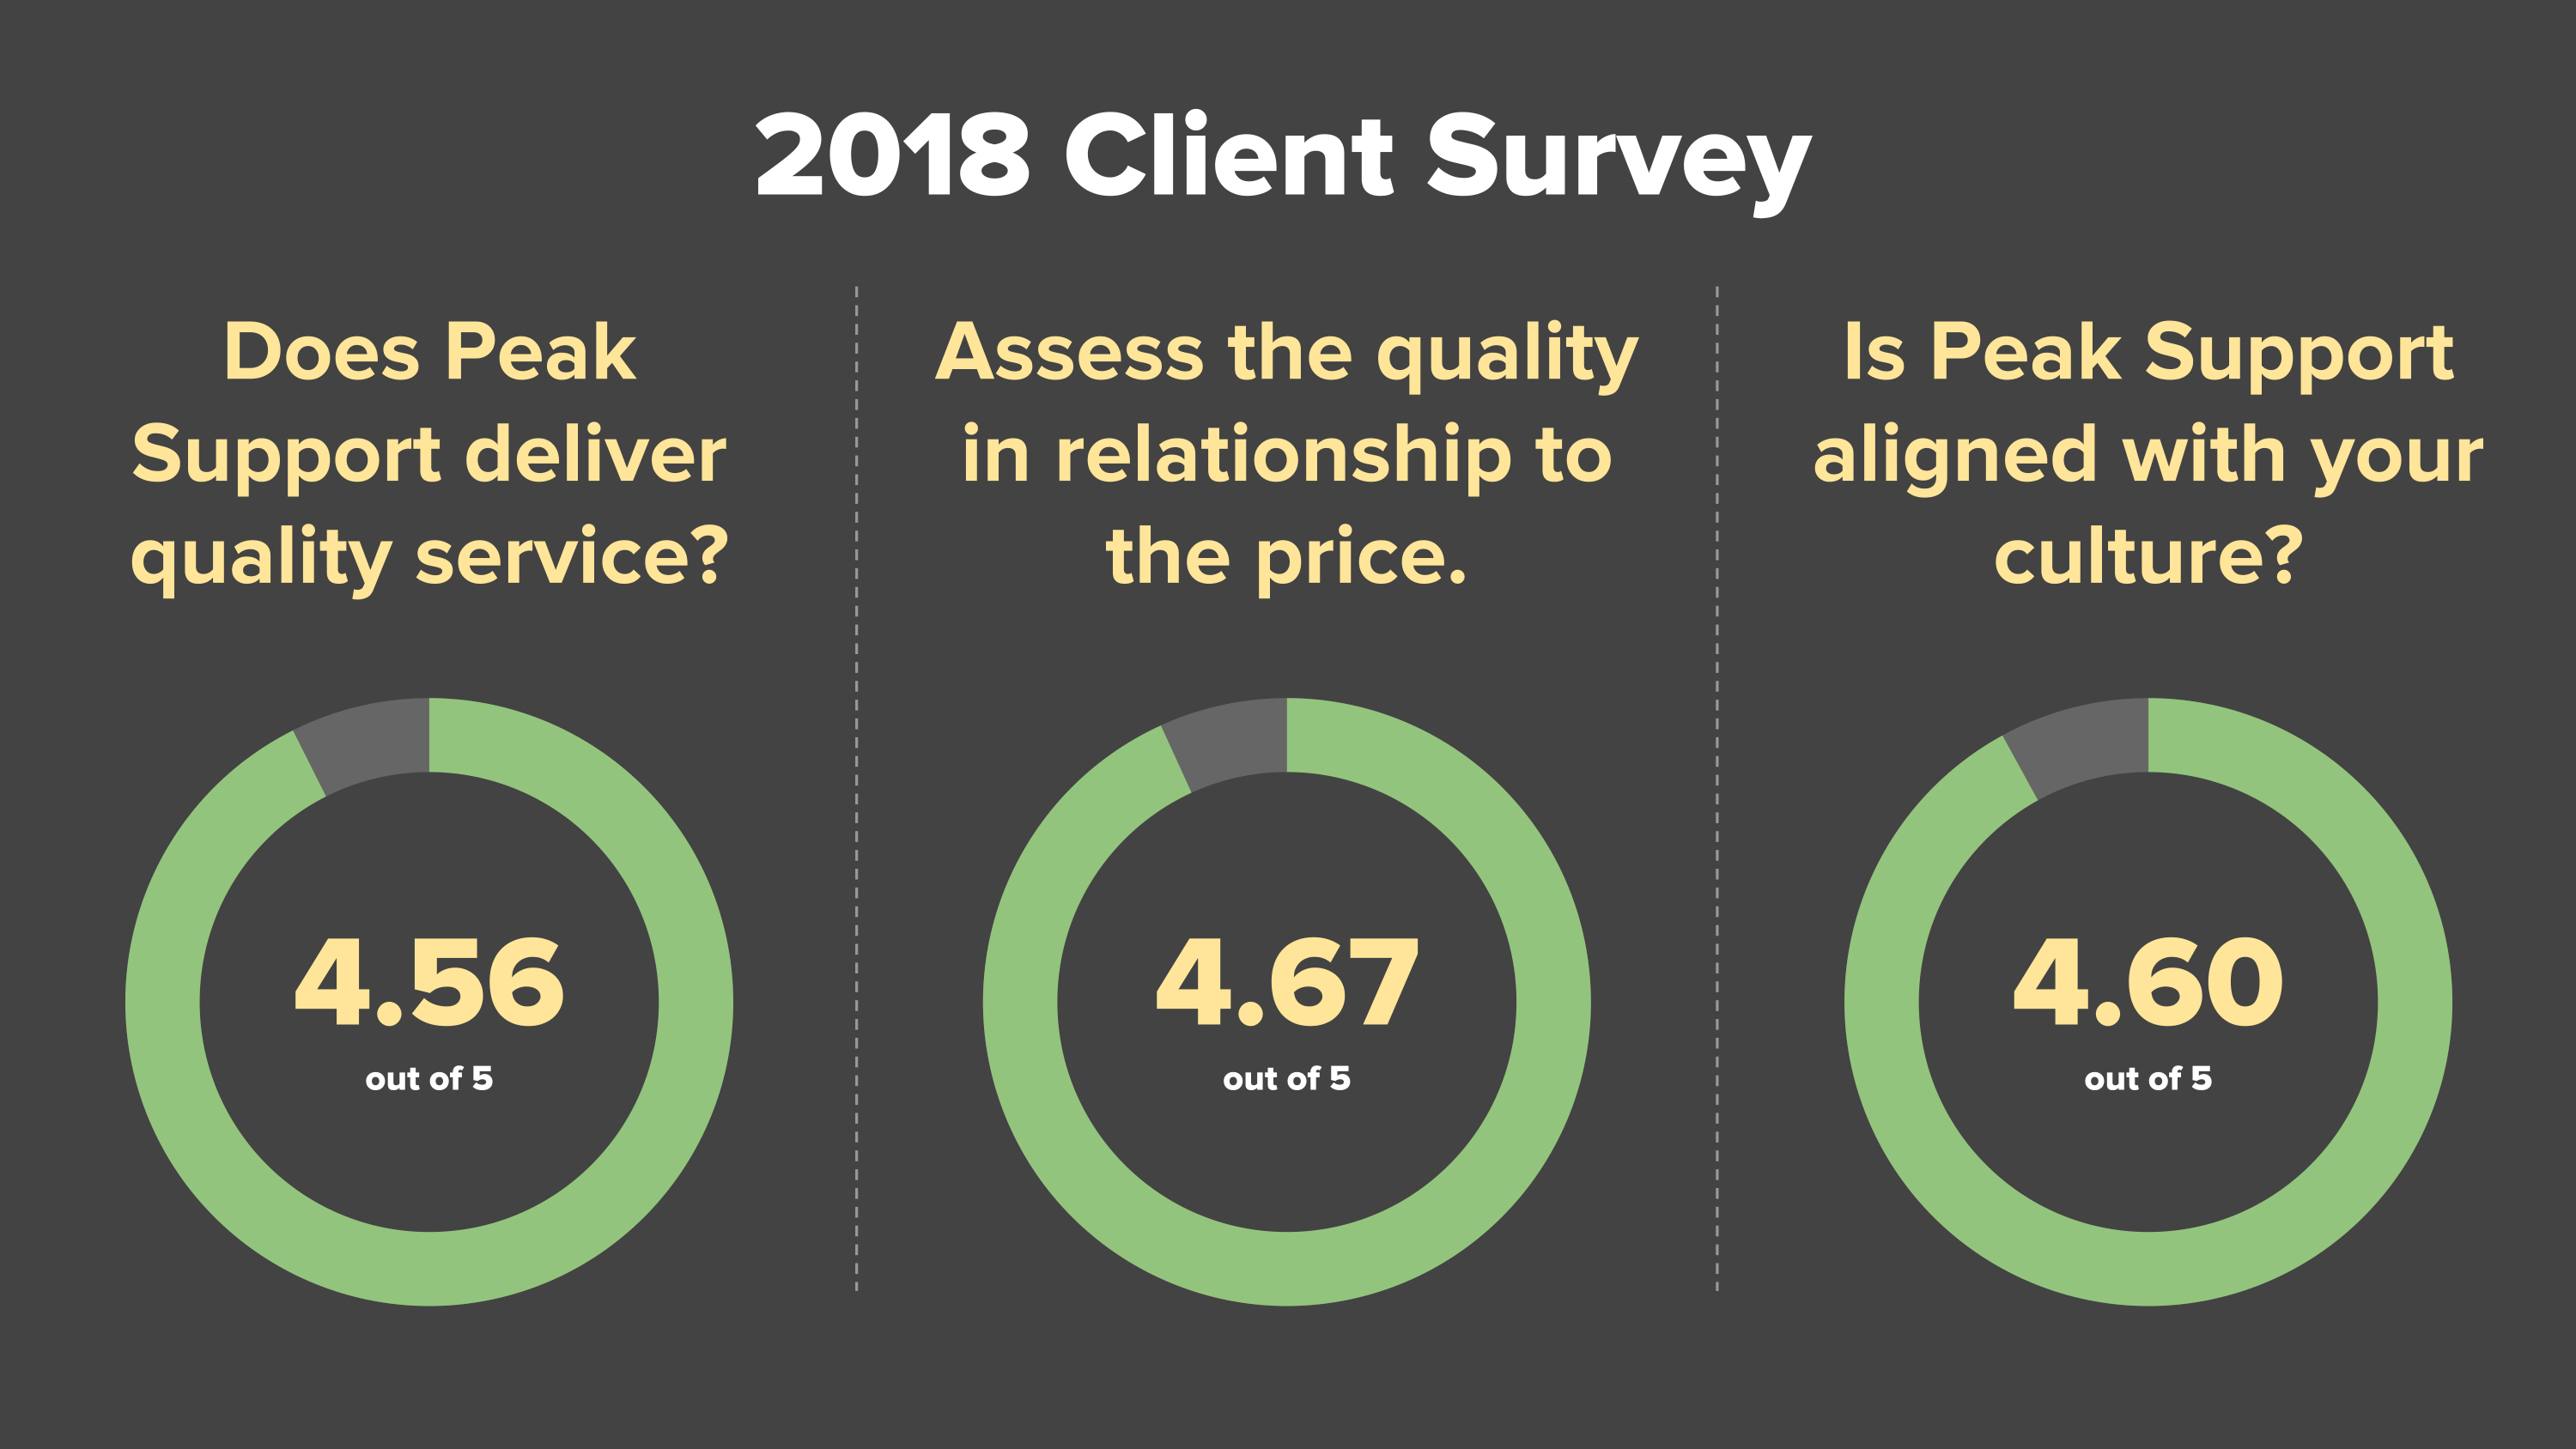
2. Do we deliver quality service?
We also ask a series of specific questions on quality, value, and culture. We want to make sure we’re providing great service at a reasonable price. And since we work with a lot of growing technology clients, cultural alignment is critical. All of our clients care deeply about their company culture and want to make sure their partners – and their customer service agents – care about it as well. We’ve improved significantly in this area, with the average assessment increasing from 3.7 (out of 5) in 2015 to 4.6 today.
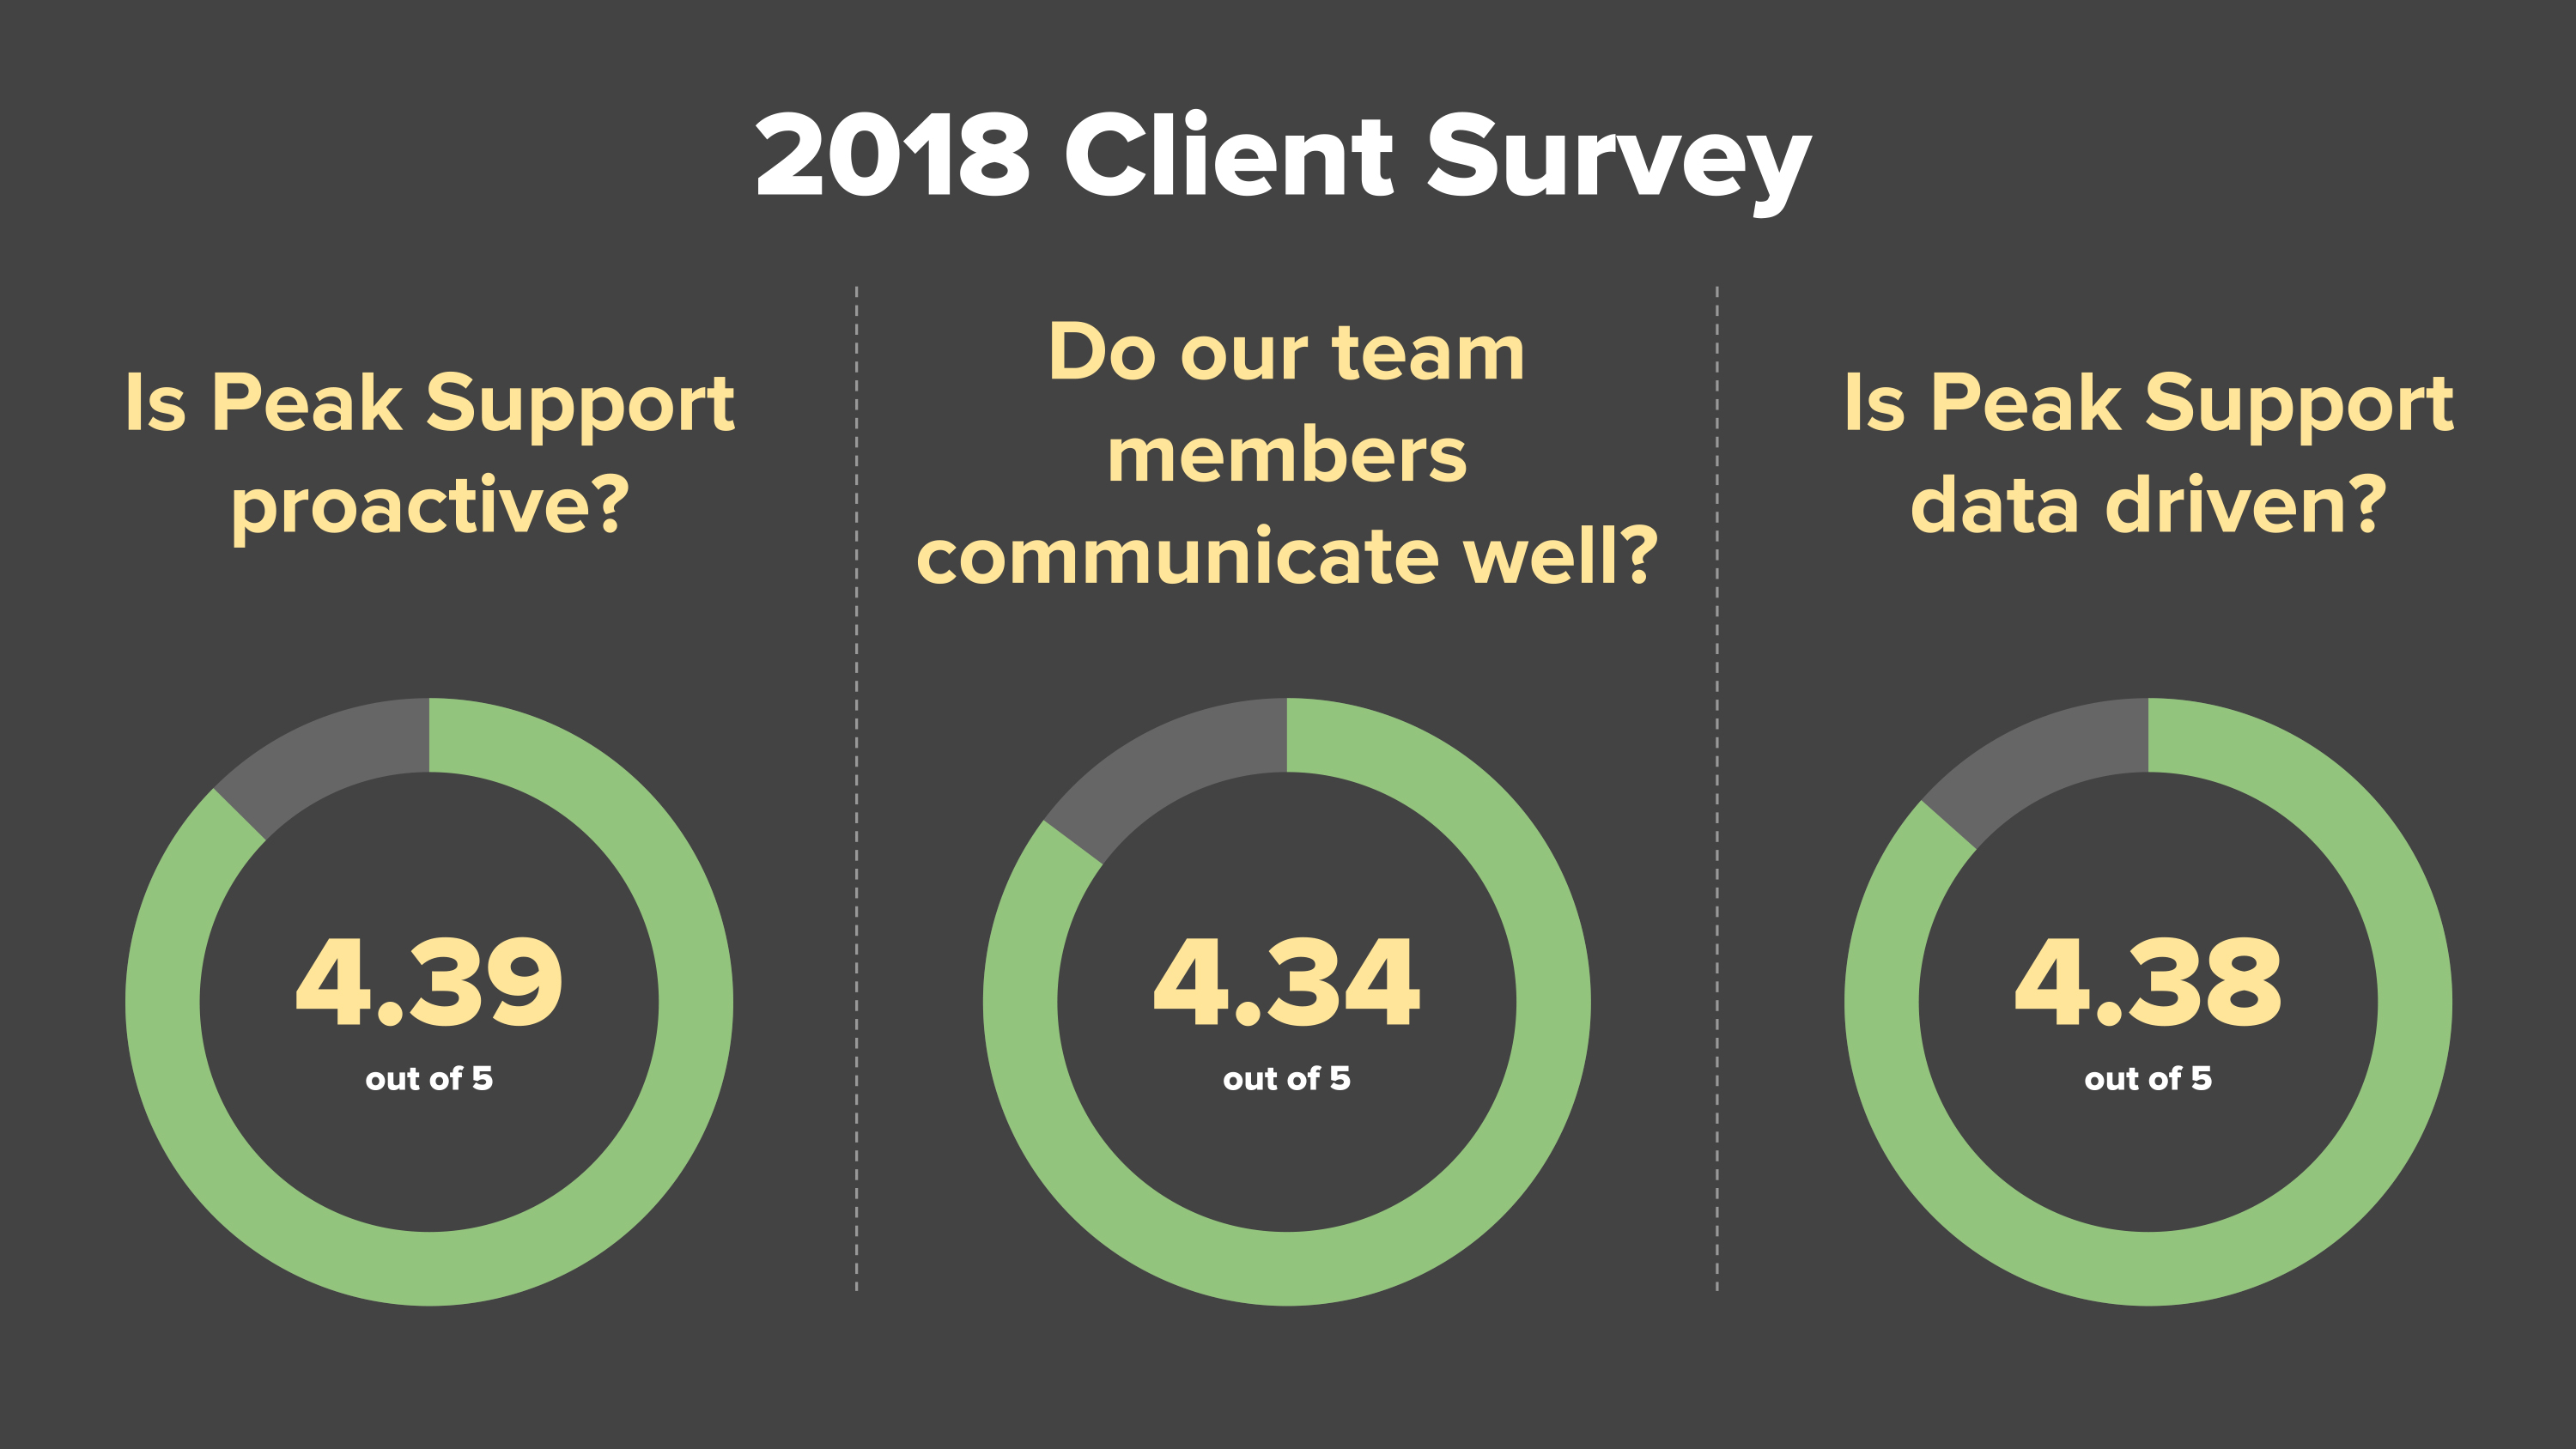
3. The specifics: Communication, data, and proactiveness
Finally, we ask some more specific questions about what it’s like to work with us on a day-to-day basis. Do we communicate well? Do we proactively address problems? And do we use data to drive results? We’ve improved significantly on both data and proactivity over the last four years, and that’s no coincidence. In order to proactively address problems, you need data.
We’ve made large investments in this area, building a centralized data analysis function in 2018 in order to drive improved reporting and analysis across all clients.
Are we doing well? We think so, and we’re thankful that our clients do, too. But we have no plans to stand still. This year, we’re making new investments in recruiting, training, analytics, and more. We’re excited for everything that 2019 has in store!

Written By: